
Table of Contents:
The portal has two main working views: the organization view and the project view. Read the sections below to learn what features are available in each portal view.
Organization view
The Organization view is the main portal view that appears immediately after you log in. From this level, you can manage organizations, sites, and projects, including the users assigned to each of these areas. Below, you’ll find a description of the individual elements visible on the screen.
Available sites and projects panel
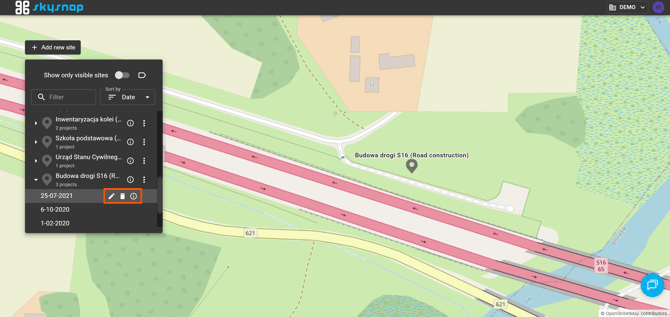
In this section, you can find all sites and their projects assigned to your account. The pins displayed on the map indicate the locations of your sites.
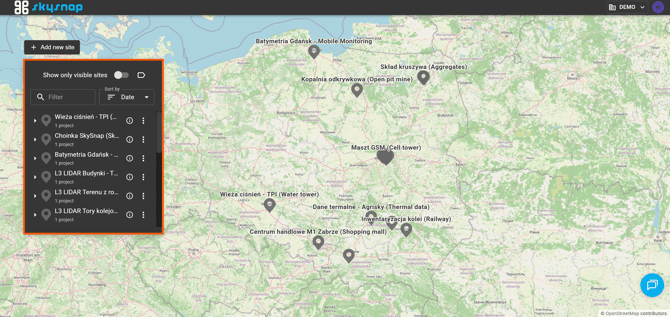
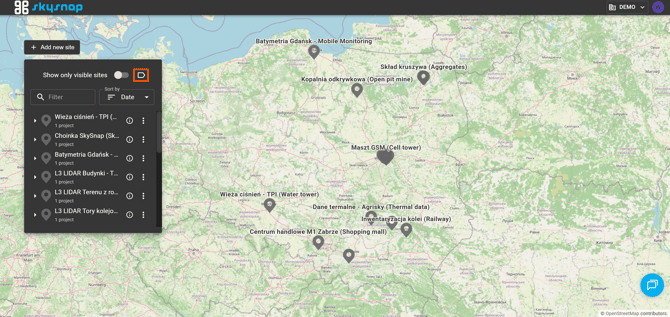
Site labels on the map
Use this button to hide the site labels on the map. After clicking it, only the pins will remain visible.
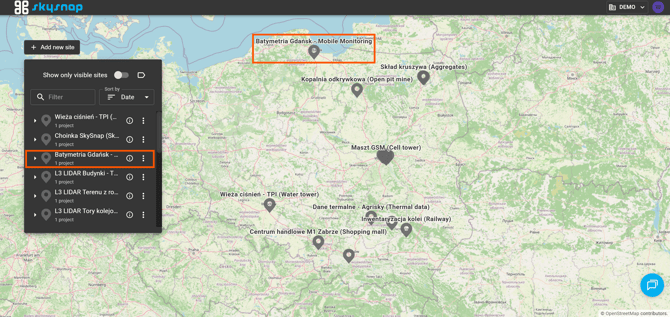
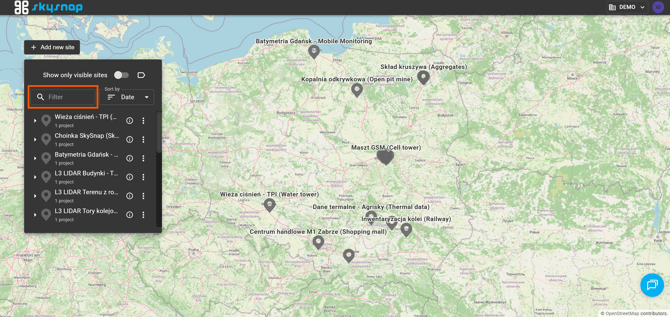
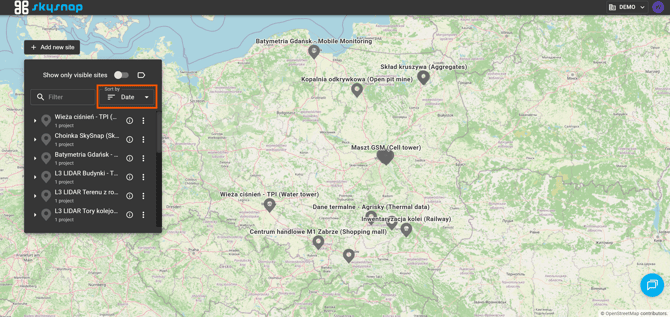
Search and filter sites
You can easily find the site you are looking for by entering its name or project date, or by using the sorting window.
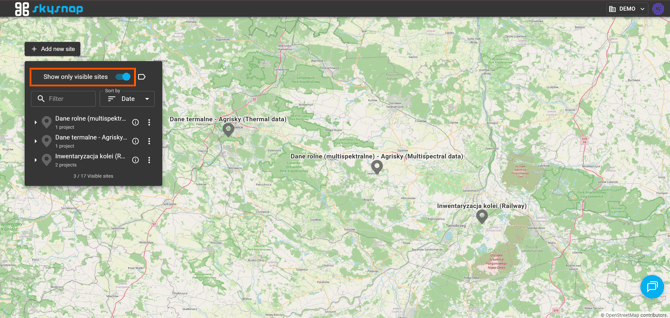
Show only visible sites
This option lists only the sites currently visible within the map view.
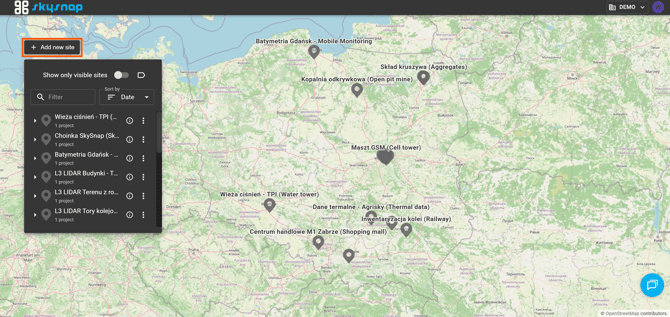
Add a new site
Use this button to add a new site (location).
TIP: For more information about this feature, see the article on adding a new site.
Logo SkySnap
The logo is visible in every portal view. Clicking it takes you to the main view, which is the Organization view shown in the graphic above.
Active organization
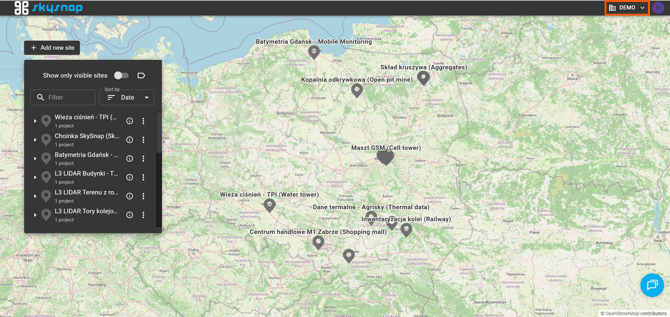
This window displays the currently selected organization. Click it to expand the list of available organizations, where you can switch between them and manage them, including adding users, changing their roles, and editing organization settings.
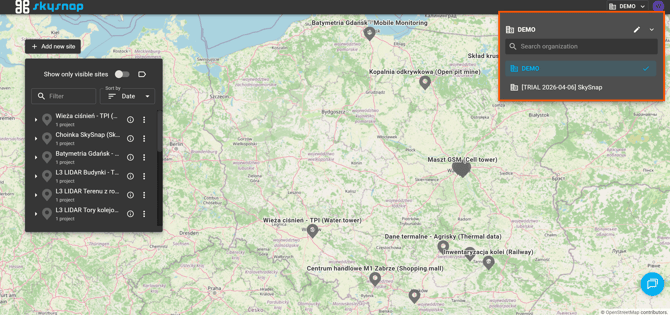
TIP: For more information, see the article on editing an organization and managing its users.
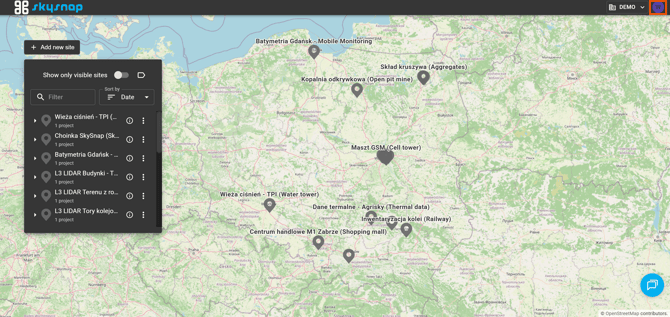
User avatar
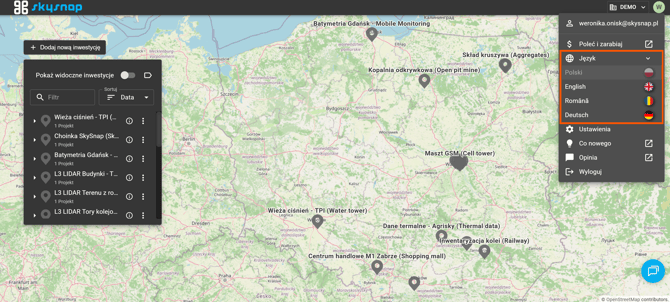
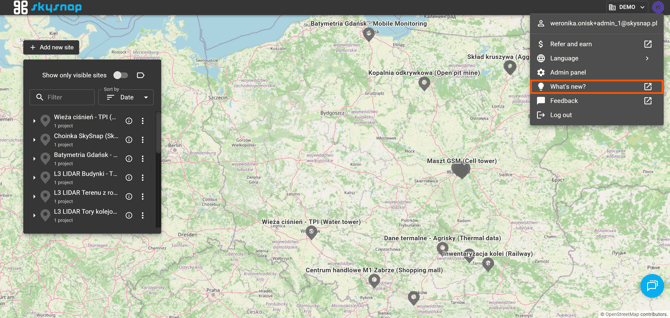
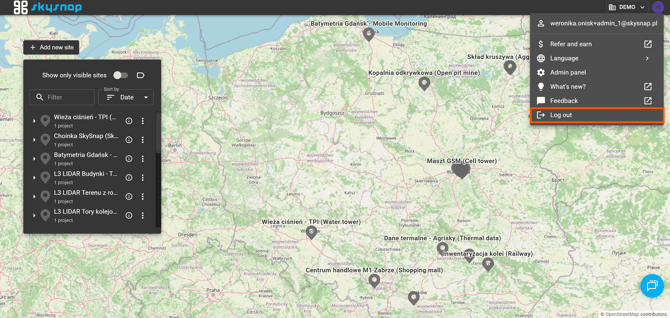
Clicking the account avatar opens a menu where you can, among other things, change the portal language, review what’s new in the latest system update, and log out of the portal.
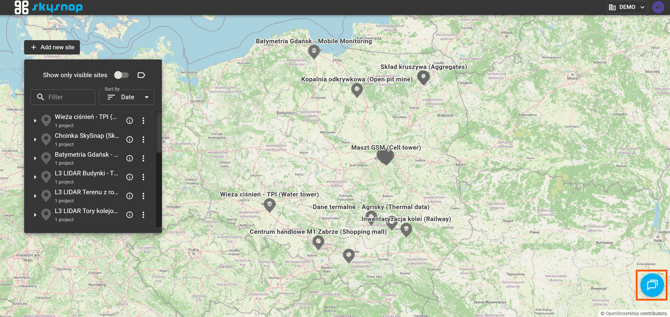
Chat with our specialists
If you have any questions or concerns, you can contact us via chat.
Site projects
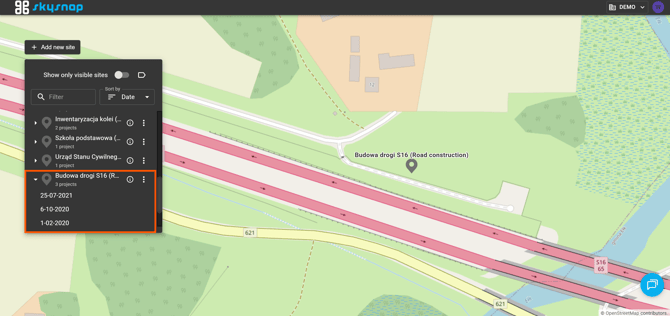
Clicking a selected site expands the list of projects assigned to it, arranged in chronological order from newest to oldest. If the site name is long, you can display it in full using the additional “i” icon . The three-dot icon allows you to manage the site and add a new project.
TIP: For more information, see the articles on editing a site and managing its users and also adding a new project.
When you hover over a project, three additional project tools appear:
-
pencil – edit the selected project,
-
bin – delete the selected project,
-
“i” – display the name of the selected project.
Project view
This is the level where you can manage all data and perform spatial analyses using the measurement tools and automations we provide.
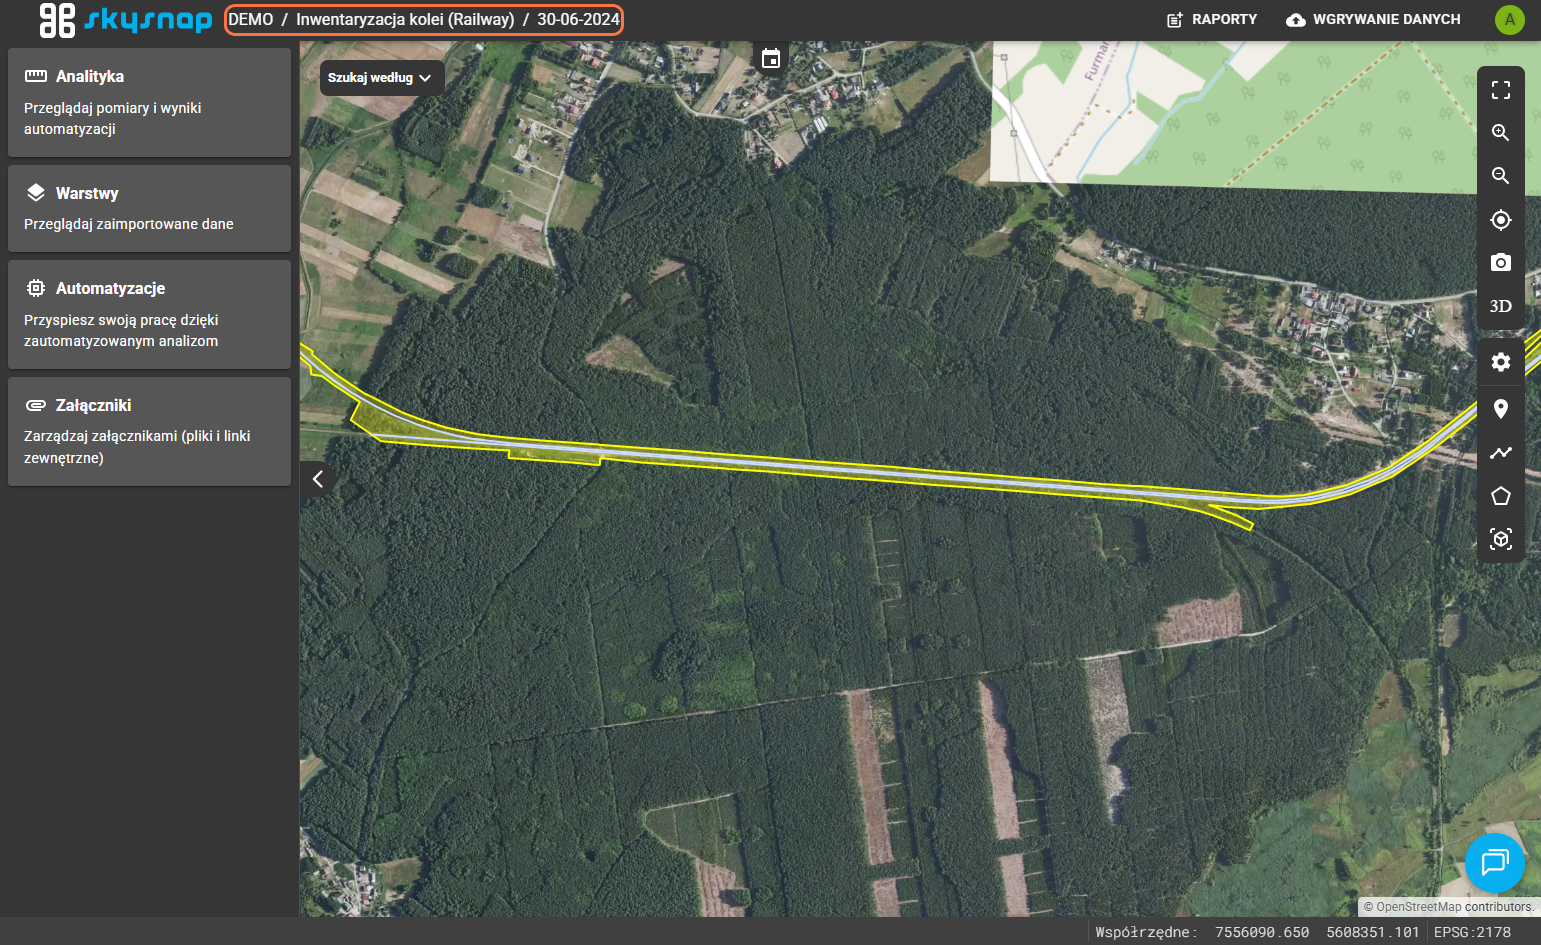
Bar with the name of the currently viewed organization, site, and project
The bar visible in the top panel of the interface allows you to quickly check which organization, site, and project are currently displayed. It is also interactive, allowing you to switch between sites and site projects without returning to the main page.
Site project timeline and comparison panel
Clicking the calendar icon displays the timeline of projects for the selected site. 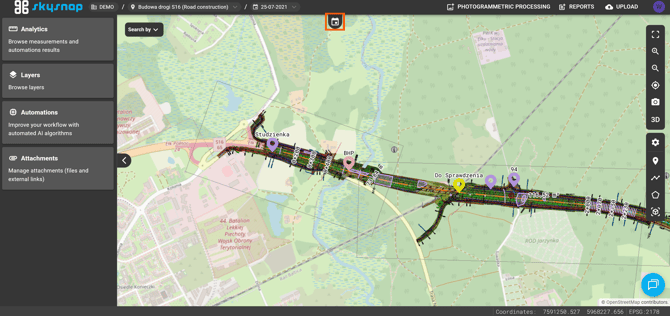
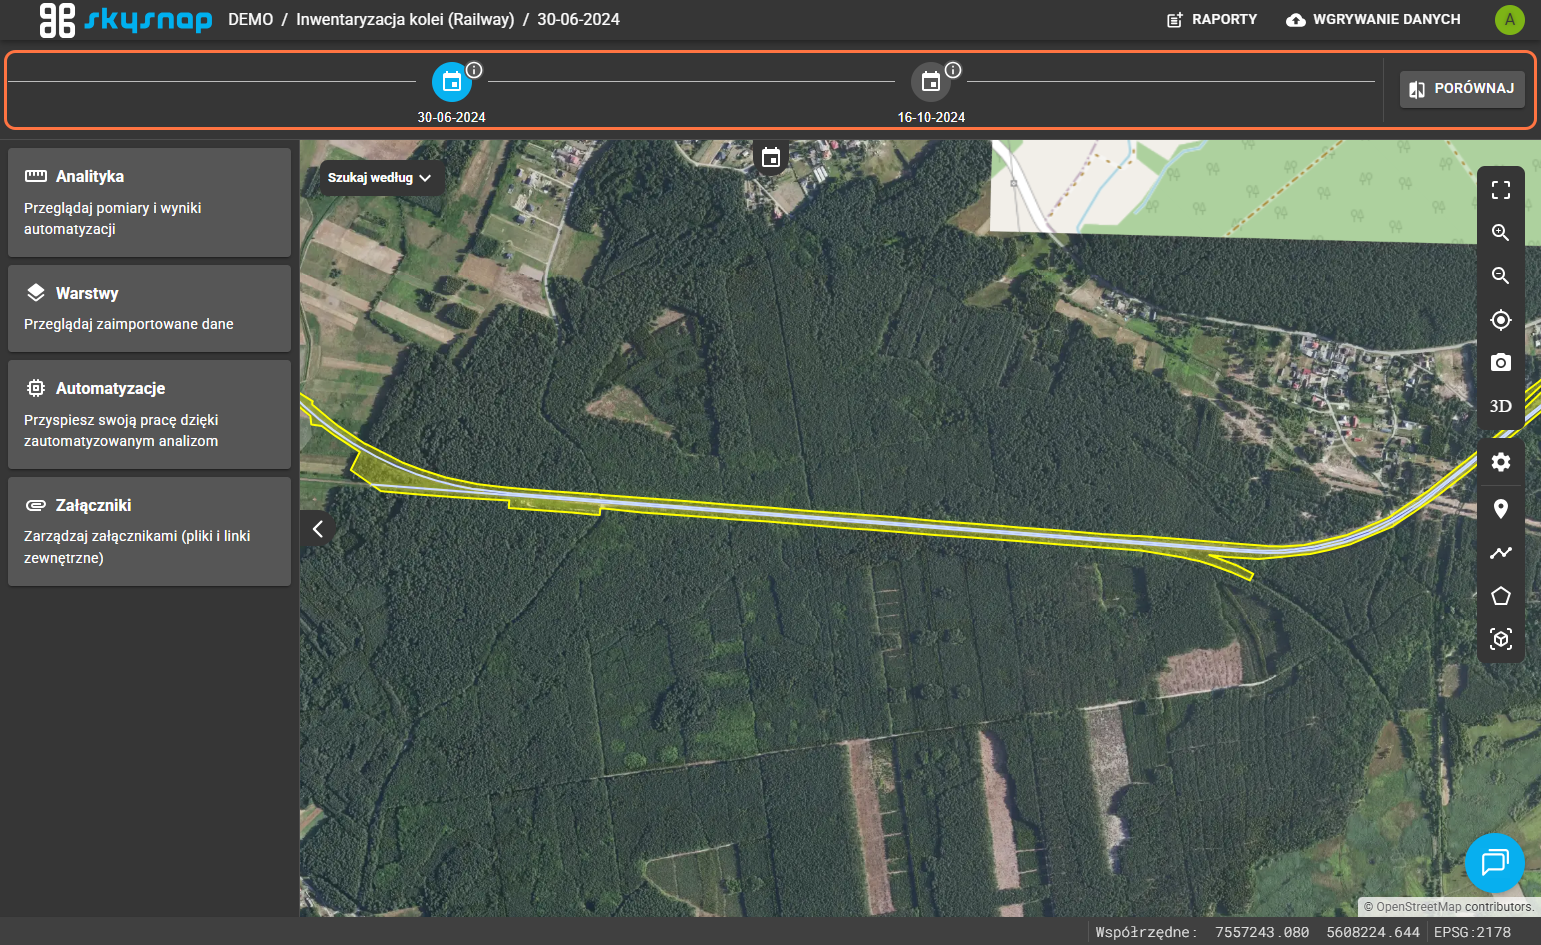
The active project is highlighted in blue.
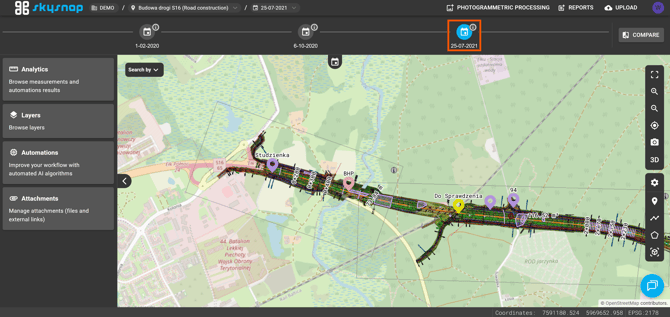
Project comparison
In addition, the "COMPARE" button allows you to compare two projects selected by the user.
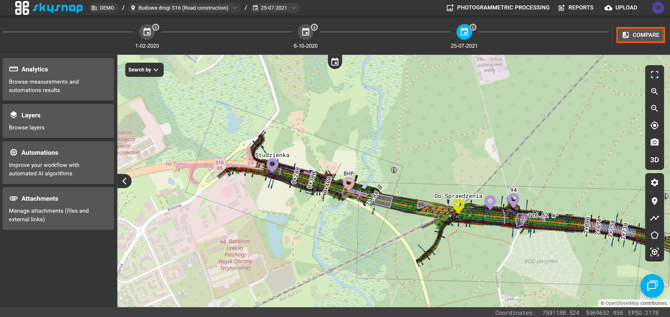
TIP: For more information, see the article on the project comparison view.
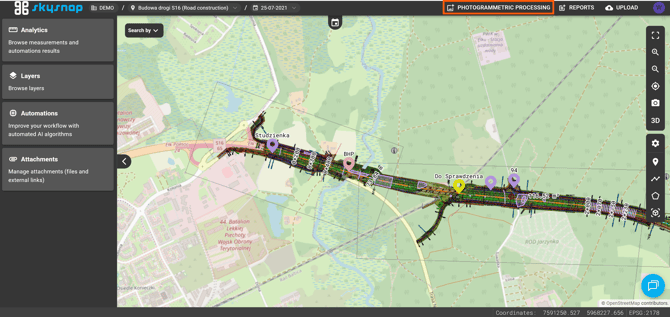
Photogrammetric image processing
You can choose between automatic and expert processing.
TIP: For more information, visit our pages:
- automatic processing (https://app.skysnap.com/services/photogrammetry_processing/),
- expert processing
(https://skysnap.pl/usluga-procesowania-danych-z-dronow-ekspercka/).
Report generation
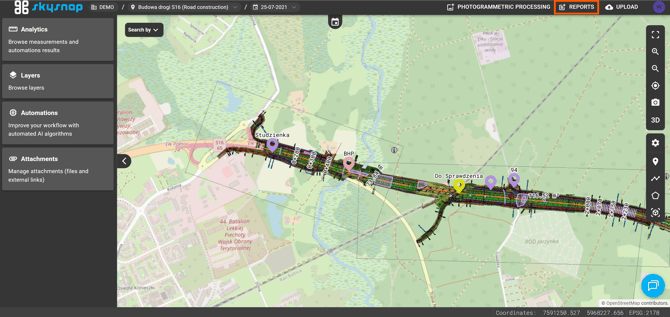
The portal allows you to generate different types of reports, each linked to different system functions.
TIP: For detailed information on report generation, see the article on reports.
Data upload
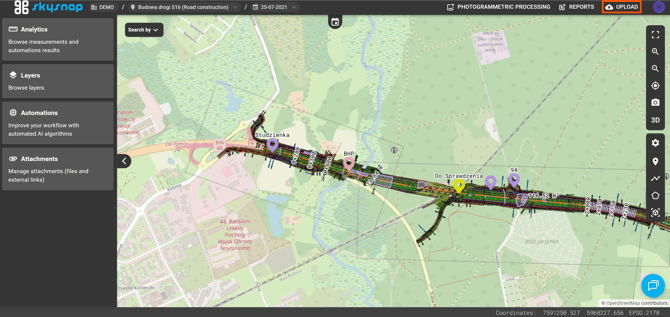
Next to your avatar, you’ll find a data upload button that opens a window where you can select file types and quantities.
TIP: For detailed information about data types, recommendations, and how to upload them to the portal, see the article on data upload.
Left sidebar in the Project view
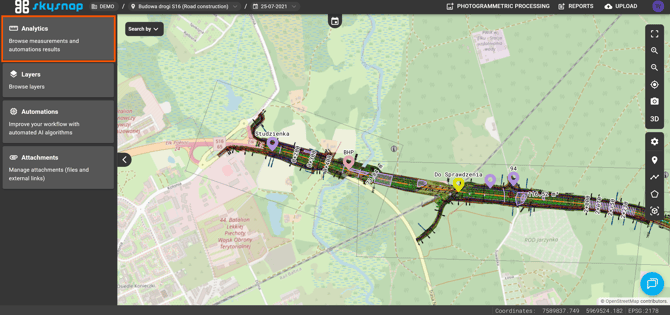
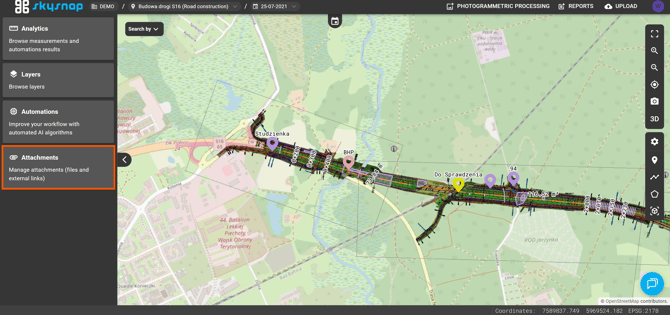
The left sidebar contains the data management panel. It includes four main navigation tiles.
Analytics
The first tile, called "Analytics", contains all measurements entered in this project — both those added manually and those generated through automation.
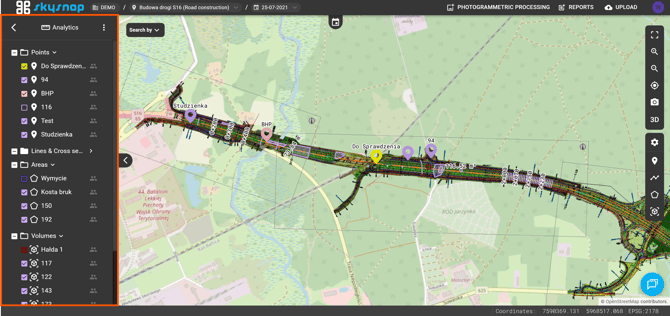
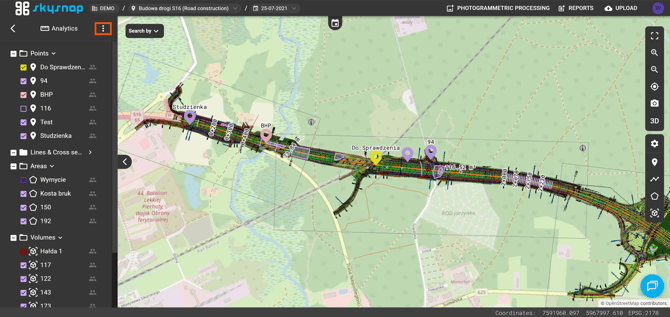
This panel includes a three-dot icon. Clicking it opens additional measurement management options:
-
add a folder,
-
export analytics data,
-
copy analytics data.
TIP: If you’d like to learn how to take measurements and export them, see the article on performing measurements.
Layers
The second tile, called "Layers", contains all layers uploaded to the Portal, assigned to the appropriate folders named by data type. 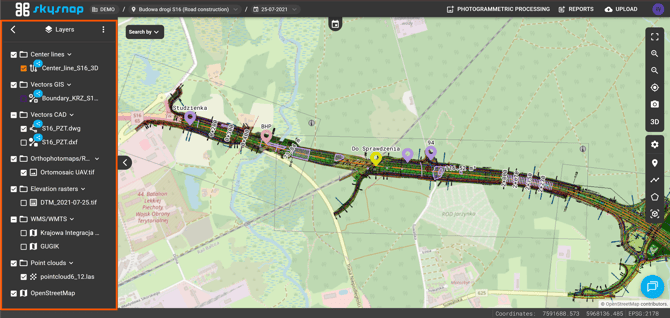
Clicking the three-dot icon displays the option to add a new folder, which lets you organize the data you need in one place. From this level, you can also add WMTS and WMS layers.
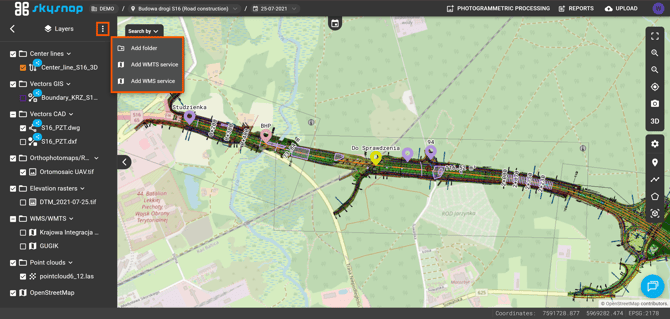
TIP: Want to learn what WMTS and WMS are and how to add these services to the portal? Read the article on connecting data via WMS/WMTS services.
Automations
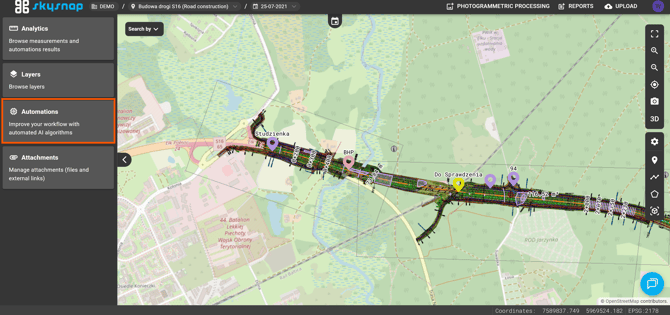
The third tile, called "Automation", contains algorithms that allow us to automate tasks and speed up our work. The results of the automation will appear in the Analytics tile mentioned earlier.
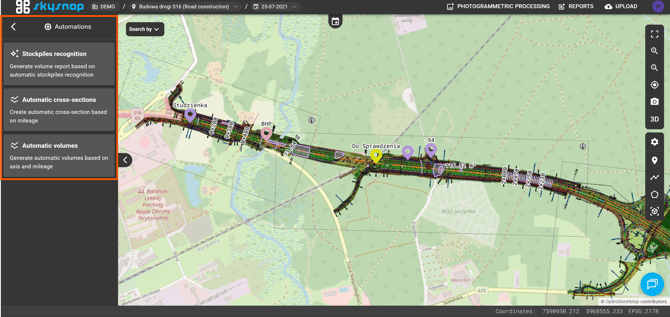
TIP: For more information about individual automations, see the dedicated articles:
Attachments
The fourth tile, called "Attachments", contains files and external links that can be stored on a project or site.
Right sidebar in the Project view
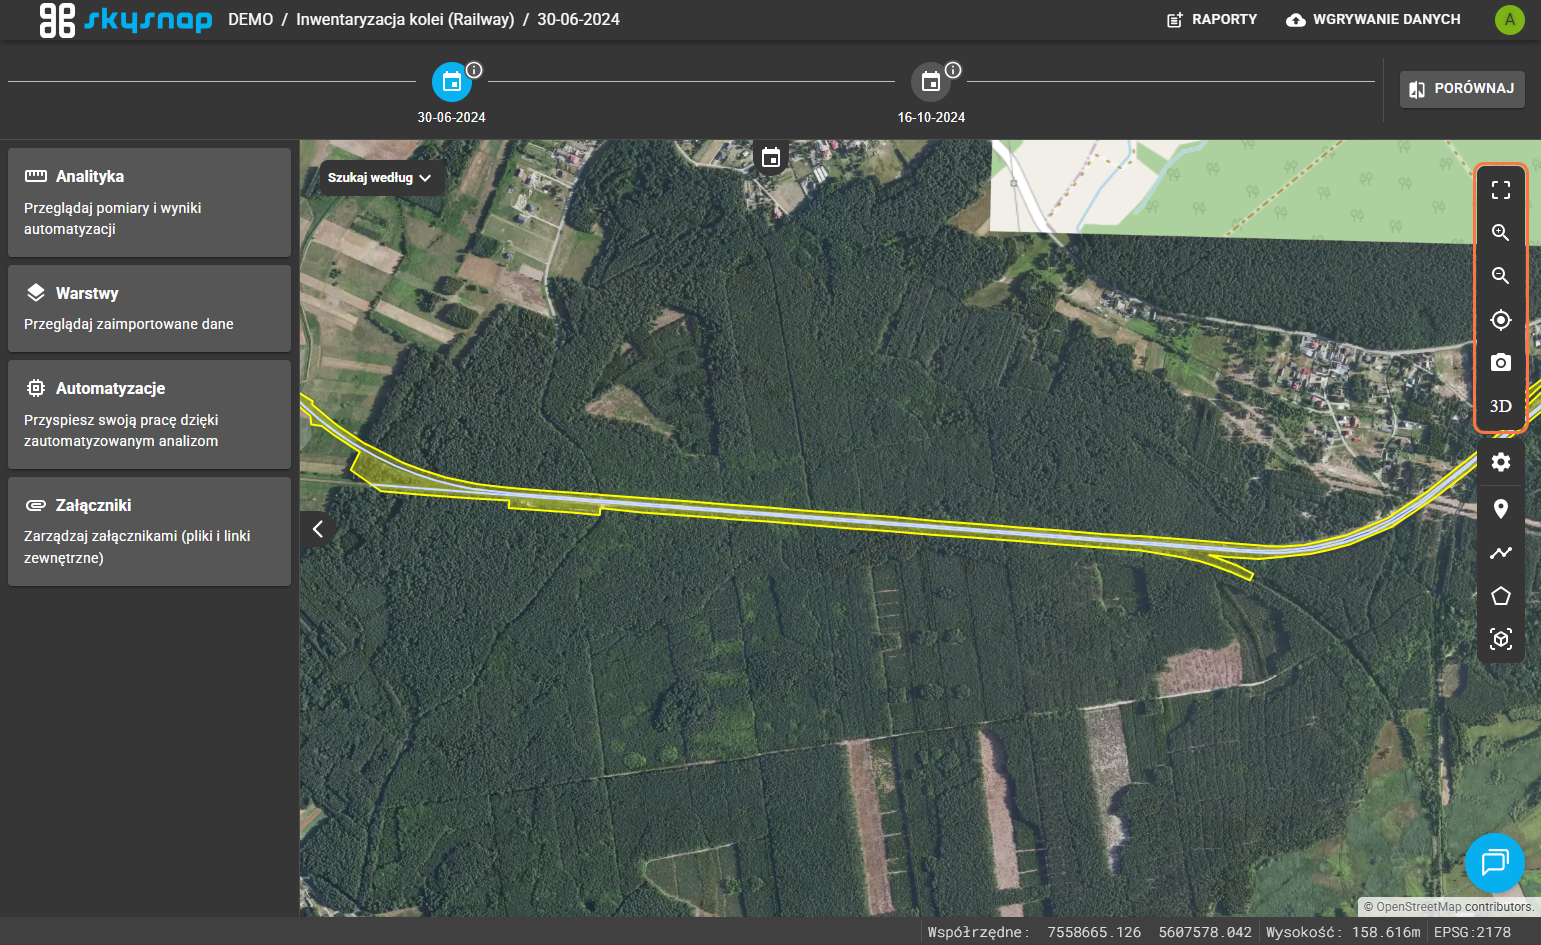
With the tools available in the toolbar, you can:
- zoom the map view to the extent of the data uploaded to the project,
- zoom in on the map view,
- zoom out of the map view,
- place a pin at your location,
- take a screenshot,
- enable 3D view.
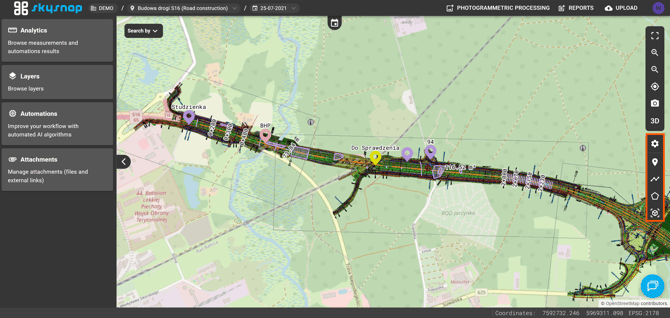
The tools below allow you to take measurements:
- change measurement settings,
- place a pin,
- measure distance,
- measure area,
- measure volume.
TIP: If you’d like to learn how to take measurements, see the article on performing measurements.