
Table of Contents:
Processing and results in Analytics
Requirements and permissions
The project must contain a point cloud in the .las format.
A .las file is the only supported point cloud format for this tool. .laz files are not supported.
IMPORTANT: The automatic stockpile detection feature is available only to users assigned the Administrator role. If you are unsure what permissions are assigned to specific user roles, see the article about user roles.
Automation
Select the organization, then the site and project you want to work with. Click the “Automations” tab in the left-hand panel and select the “Stockpile recognition” process.
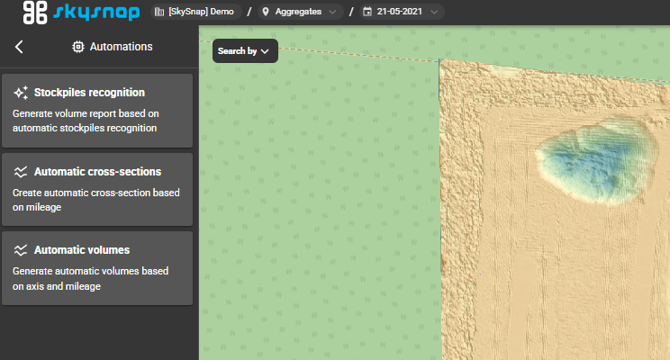
TIP: Want to learn how the other automations work? Their descriptions are available in the articles below:
Process parameters
After selecting the “Stockpile recognition” function, a window will appear where you define the layers and surfaces used to generate volume calculations.
Select data — indicate the point cloud layer (a layer with the .las extension).
Below, in the "Automatic volume calculation" section:
Surface —select the base surface for calculating the volume: a layer generated by rasterizing the point cloud or another raster surface (.tif, e.g. DTM/DSM).
Reference surface — the surface against which the volume will be calculated. Select one of the following two options:
- Defined elevation — after selecting this option, the H field will appear, where you enter a value above sea level (e.g. 120 [m]); this creates a flat surface that can represent the zero state before construction begins,
- Another surface — an existing surface in the form of a raster file or point cloud, for example:
- zero state,
- elevation data from another flight (in this case, the difference between two dates will be calculated),
- a design surface.
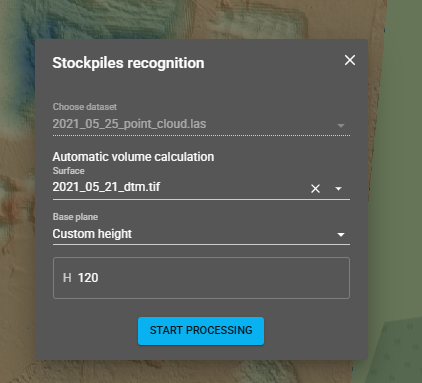
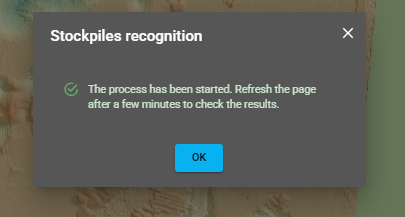
Click “Start processing.” A message will appear confirming that the stockpile generation process has started.
Processing and results in Analytics
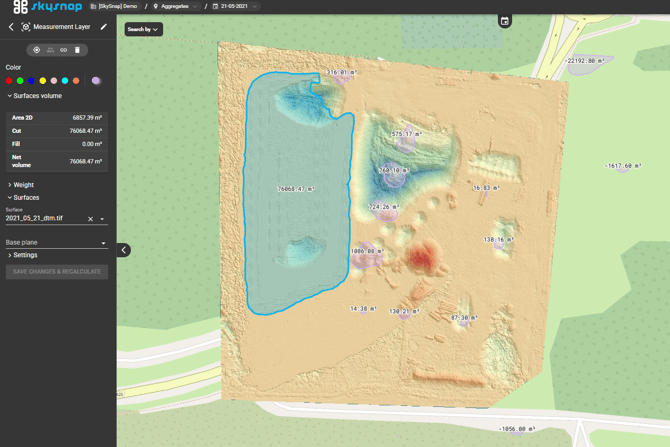
After a few minutes, refresh the page and go to the “Analytics” tab — all detected stockpiles will be visible there. Stockpiles are also displayed directly on the map together with their calculated volumes [m³].
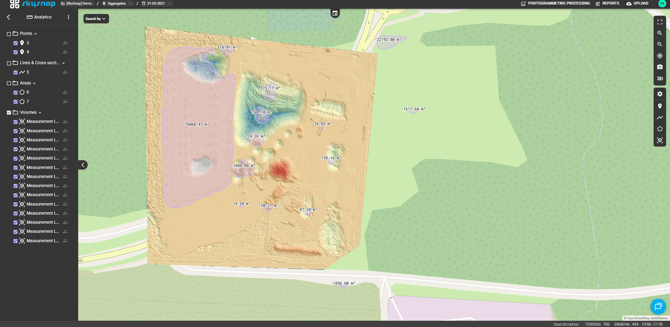
When you click a selected stockpile — either in the list on the left-hand side or directly on the map — the parameters of the selected object will be displayed:
- Area 2D [m²],
- Cut [m³],
- Fill [m³],
- Net volume [m³],
and below that, the surface and reference surface used to calculate the volume. Next to the object name, you will see icons for: color (individual object color), target (location on the map), sharing, and bin (remove object).
Editing detected stockpiles
For each detected object, you can:
- change its name — double-click its current name,
- assign an individual color to each object,
- delete the object,
- in Settings, define the label, line thickness, and line style according to your preferences,
- change the surface and reference surface used for volume calculations.
Korekta kształtu hałdy: jeżeli algorytm nieprawidłowo zdefiniuje hałdę, możesz edytować jej kształt — chwyć wierzchołek i dostosuj obrys do rozmiarów właściwej hałdy. Po zmianie kształtu wartości objętości zostaną wyzerowane (wyświetli się „–") do czasu ponownego przeliczenia.
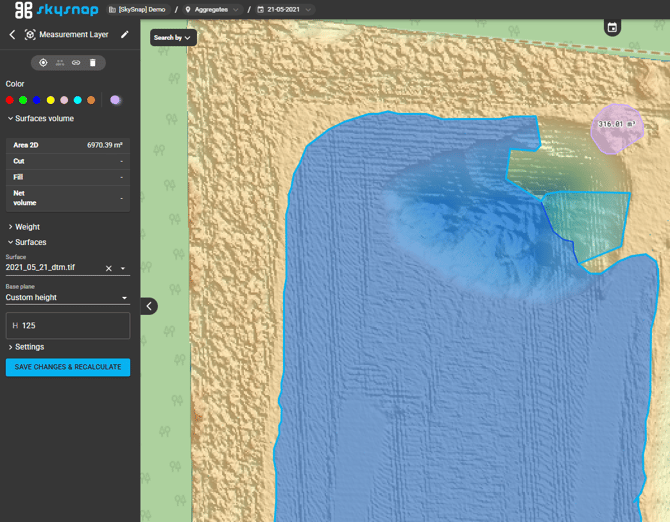
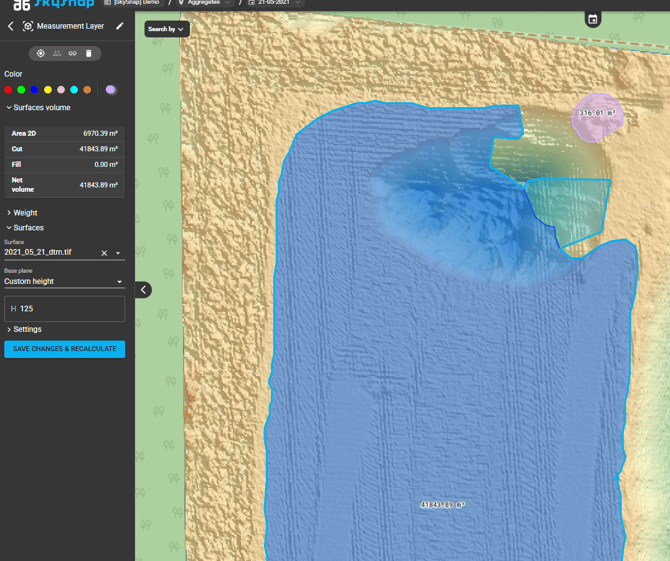
Click “SAVE & RECALCULATE” — once recalculation is complete, the new values will appear.
Generating a report
Click the selected report type in the menu. A configuration window will open, where before generation you can set:
- Logo — upload your organization’s logo (Choose file); it will appear in the report,
- Main color — the default color of report elements,
- Area unit — e.g. m²,
- Comment — any description that will appear on the report’s title page.
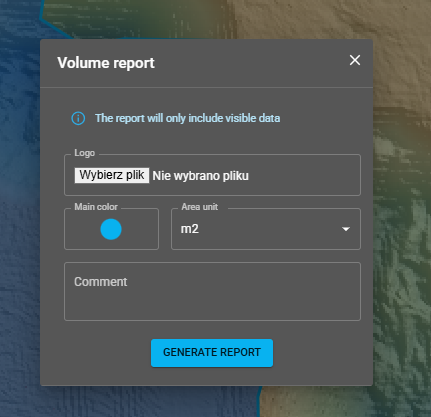
WARNING: The report will include only visible data — objects that are turned off (hidden) in the project will not be included. Before generating the report, make sure that all required objects are enabled.
Click “Generate report” — the completed report will be sent to your email address, and a message will appear confirming that the process has started.
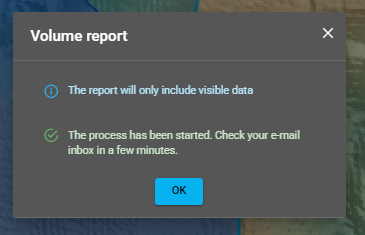
After clicking it, the following message will appear: “The process has started. Check your email inbox.” — the report is generated and sent directly to the user’s email address.
Report
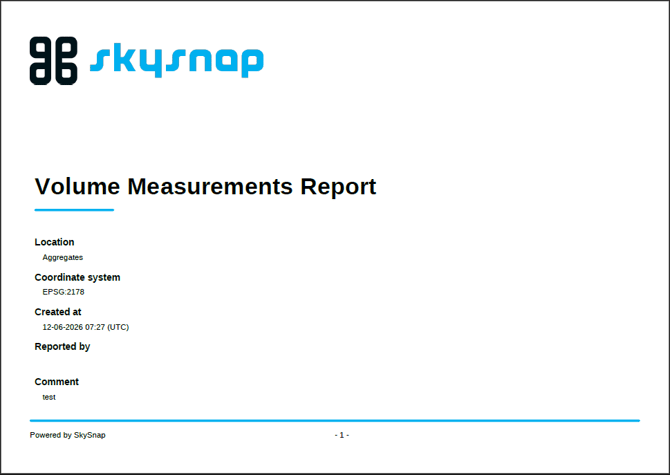
The Volume Measurements Report contains:
- a title page with the following information: logo (of your organization, if uploaded), report name, location (site), coordinate system (e.g. EPSG:2178), creation date, author, and the comment entered during report generation,
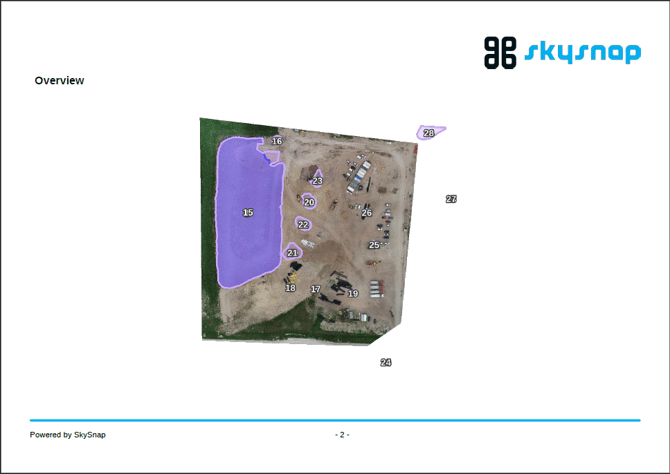
- an overview map page showing the numbered geometries of all surfaces included in the report,
- a results table for each polygon: ID, Area [m²], Cut [m³], Fill [m³], Net [m³]; the dot next to each row is shown in the color assigned to the object in the portal.
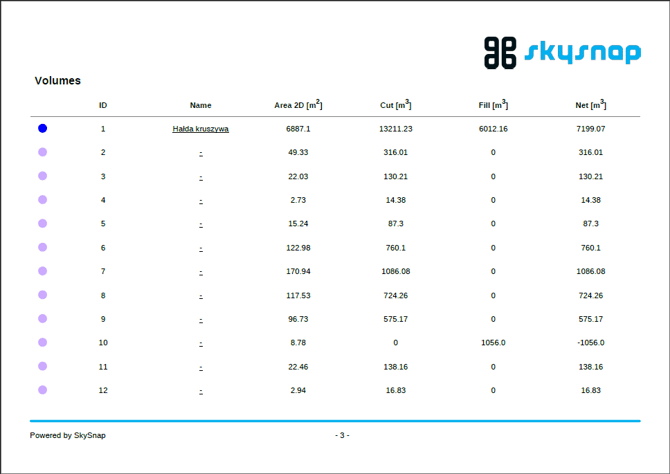
TIP: The Name column displays the names assigned to objects in the portal — it is worth naming the most important objects before generating the report so that the summary is clear and easy to read.