
Table of contents:
Symbology determines how data is presented on the map and in the 3D scene. All project data is listed in the Layers panel and grouped into folders by type, such as BIM, Center lines, Vectors GIS, Orthophotomaps/RGB rasters, Point clouds, and Photos.
The available styling options depend on the data type. They range from basic settings, such as color and opacity for orthophotos, through color palettes and shading for elevation rasters, to attribute-based object classification for vector layers
Appropriate symbology improves data readability and makes analysis easier.
NOTE: Layer symbology can be customized for:
-
vector layers,
-
mileage,
-
orthophotomaps / RGB rasters,
-
elevation rasters,
-
point clouds.
Layer properties
You can change the symbology of an individual layer in the layer properties panel. To do so:
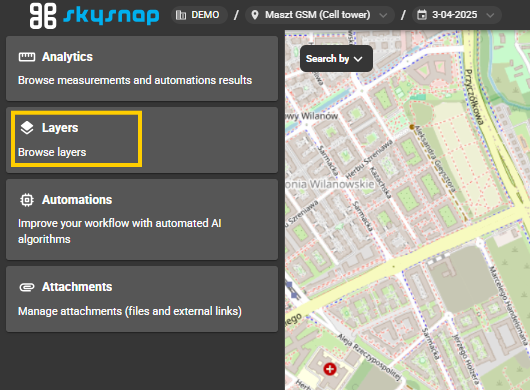
- Select Layers from the side menu to open the layer list.
- Click the selected layer in the list to open its properties.
The available options are automatically adjusted to the layer type. You will see different parameters for a vector layer, an orthophoto, and an elevation raster.
Vector layers
Vector layers include point, line, and polygon features, such as track axes, parcels, and control points. After opening the layer properties, you can access the following settings, among others:
- Color - the color of the features
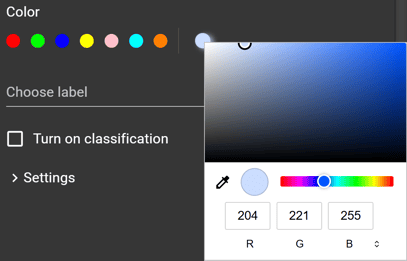
To select a custom color, click the color swatch on the far right. In the window that opens, select a color by dragging the marker to the desired position on the palette. You can also define the color manually by entering RGB or HSL values, or a HEX code. Use the arrows icon in the bottom-right corner of the window to switch between these options. The eyedropper icon allows you to pick a color from anywhere in the browser window.
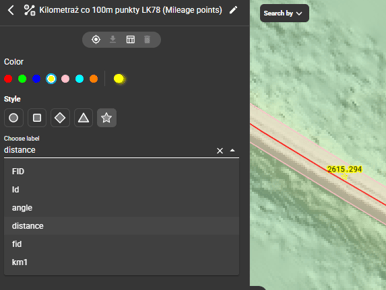
- Choose label - the attribute value displayed as a label
- Style:
-
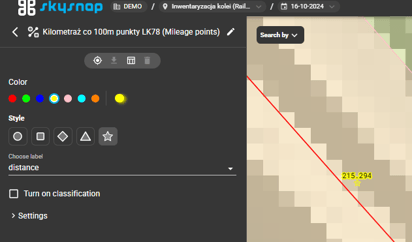
- for point layers – the symbol shape:
- circle,
- square,
- diamond,
- triangle,
- star,
- for point layers – the symbol shape:
-
- for line and polygon layers – the line style:
- solid,
- dashed.
- for line and polygon layers – the line style:
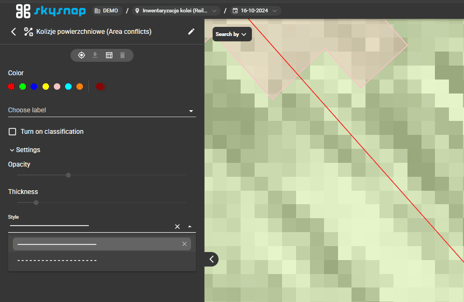
- Settings:
- Opacity,
- Thickness.
NOTE: Mileage offers symbology options similar to those available for a linear vector layer.
Vector classification
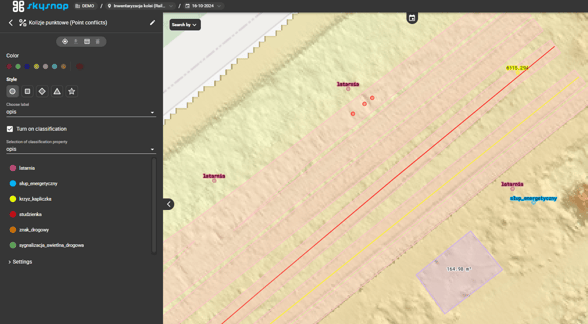
Instead of applying a uniform style, you can classify a layer by assigning different symbol colors to features based on the value of the attribute selected for classification. This makes it easier to distinguish and analyze different feature types by grouping similar features together.
- In the layer properties, select Turn on classification.
- In the Selection of classification property field, select the field used to differentiate the features, such as description.
- The list displays the unique attribute values together with unique colors, such as street lamp, utility pole, roadside shrine, manhole, road sign, and traffic light.
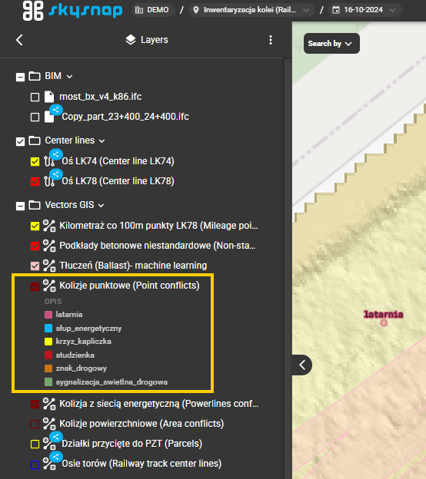
For layers using classification-based symbology, a legend is displayed in the left sidebar, directly below the layer name.
Orthophotos and RGB rasters
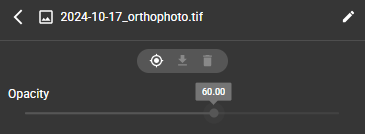
Orthophotos and RGB rasters have the simplest symbology. The only available option in the layer properties is:
- Opacity - controls the transparency of the raster, making it easier to display together with the layers underneath.
Elevation rasters
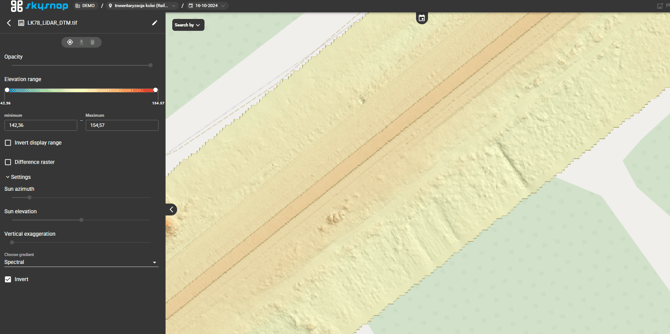
Elevation rasters, such as digital terrain models (DTMs) created from LiDAR data, offer advanced symbology based on color palettes and shading:
- Opacity
- Elevation range
Defines the range of elevation values displayed in the raster. You can set it manually using the slider or enter the minimum and maximum values in the appropriate fields.
After changing the range, the color palette remains unchanged, but its colors are reassigned to the new value interval. This makes even small elevation differences easier to see. - Invert display range
When enabled, values outside the selected elevation range are displayed, showing the complement of the selected interval. - Difference raster
When selected, the elevation range is divided into two intervals, Range interval 1 and Range interval 2. Each interval has its own minimum and maximum fields, as well as a shared boundary value. This makes it possible to highlight elevation differences around a specified threshold by displaying the areas below and above the boundary separately using the selected palette. - Settings
- Sun azimuth,
- Sun elevation,
- Vertical exaggeration.
- Choose gradient
You can choose from the following palettes:
- Heatmap,
- Gray,
- Turbo,
- Spectral.
TIP: Changing the palette and elevation range helps highlight terrain differences relevant to a particular analysis, such as slopes, embankments, and excavations.
Photos and panoramas
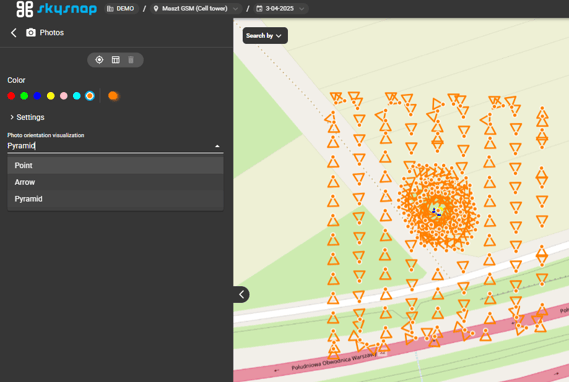
The Photos layer can be symbolized like other layers by changing its color and symbol type.
You can display photo positions using three symbol types:
-
Point,
-
Arrow,
-
Pyramid.
In addition to showing the photo position, the Arrow and Pyramid symbols indicate photo orientation and allow you to quickly assess the direction in which the photos were taken. The Pyramid symbol also approximates the area of space visible in the photograph, representing the camera's field of view.
- 2D view: displays the direction in which the photos were taken along the X and Y axes.
- 3D view: displays photo orientation along the X, Y, and Z axes.
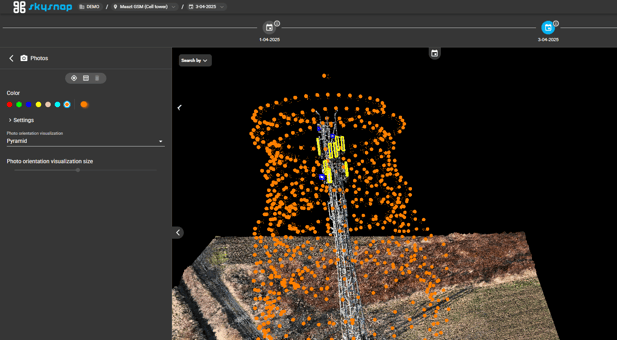
WARNING: If the parameters required to visualize photo orientation are unavailable, selecting Arrow or Pyramid displays a point symbol instead.
Point clouds
After opening the properties of a point cloud layer, such as one created from LiDAR measurements, you can adjust how the points are displayed based on their attributes and change their size. The available settings include:
- Opacity - controls the transparency of the point cloud.
- View mode - determines how the points are colored:
- RGB - displays the points in colors captured from photographs,
- Elevation - assigns colors to points according to their elevation, from blue for lower values to red for higher values. As with elevation rasters, you can adjust the elevation range to highlight points whose elevation falls within the selected interval,
- Classification - assigns colors to points according to their class, such as ground, vegetation, or buildings,
- Intensity - assigns colors to points based on the intensity of the returned signal.
- Point size mode:
- Fixed - all points have the same size, regardless of the zoom level,
- Adaptive - automatically adjusts the point size to keep the point cloud readable at different zoom levels.
- Point size - use the slider to adjust the size of the displayed points.
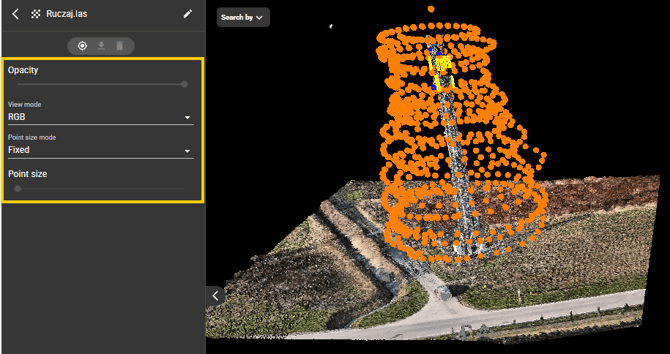
TIP: Changing the view mode, for example to Classification or Elevation, makes the data easier to interpret when the point cloud does not contain RGB color or when you want to highlight elevation differences or specific object classes.