Table of contents:
Recalculating individual sections
Requirements
To use this tool, the project must contain:
- a vector line layer representing the axis (e.g. a road axis or railway tracks),
- elevation data (elevation raster) required for volume calculations.
IMPORTANT: The axis must be uploaded as a dedicated “mileage” data type and must include a start attribute that defines the chainage at which the section begins. Based on this attribute, the portal assigns the correct chainage to each section. Without the start attribute, the data will not be processed correctly.
Process automation
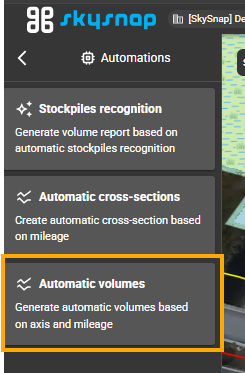
The “Automations” tile is located in the left-hand panel. There, select Automatic volumes to generate automatic volume sections based on the axis and mileage.
Other automations are described in separate articles.
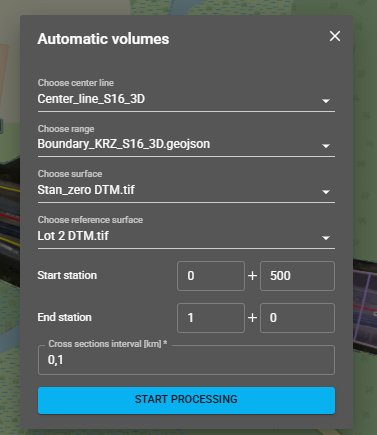
In the “Automatic volumes” window, complete the following parameters:
- Choose center line — the line layer along which the sections will be generated (e.g. Center_line_S16_3D),
- Choose range — a vector layer defining the clipping area (e.g. project boundaries); optional parameter,
- Choose surface — the base surface (e.g. Stan_zero DTM.tif); required field,
- Choose reference surface — the comparison surface (e.g. Lot 2 DTM.tif); required field. The volume is calculated between these two surfaces,
- Start station / End station — the section chainage in chainage format (two fields: km + m),
- Cross sections interval [km] — the frequency of sections (e.g. 0.1 = one section every 100 m).
Click “START PROCESSING.”
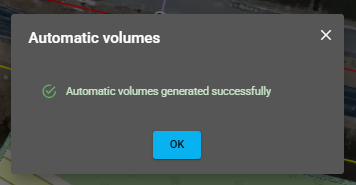
When processing is complete, the message “Automatic volumes generated successfully” will appear.
Results in the Analytics tile
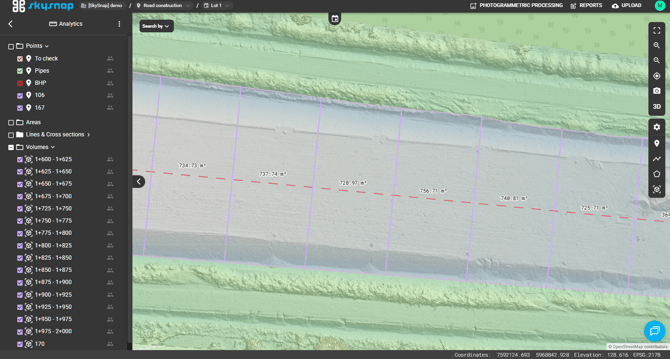
The generated sections will appear in the Analytics tile, in the Volumes group. Once processing is complete, the solids are automatically displayed on the map along the axis, labeled with chainage (e.g. 0+500 - 0+600) and volume value (e.g. -16282.57 m³).
Click any section to open the details panel. The Surfaces volume section displays:
- Area 2D — the 2D projected area of the section (e.g. 5101.54 m²),
- Cut — excavation volume (e.g. 1209.40 m³),
- Fill — embankment volume (e.g. 17491.98 m³),
- Net volume — the net balance of cut and fill (e.g. -16282.57 m³).
Map with volume sections distributed along the alignment.
Recalculating individual sections
Each section can be recalculated individually by changing the surface and reference plane. In the section panel, expand Surfaces and set:
- Surface — the surface against which the volume is calculated (e.g. Lot 2 DTM.tif),
- Base plane — the reference plane:
- Interpolation,
- Highest point,
- Lowest point,
- Comparison map,
- Custom height.
In the Settings section, set Choose label — the value displayed as the section label on the map:
-
Name,
-
Area 2D,
-
Cut,
-
Fill,
-
Net volume,
-
Cut/Fill/Net.
Click “SAVE CHANGES & RECALCULATE.” The values in the table and the label on the map will be updated.
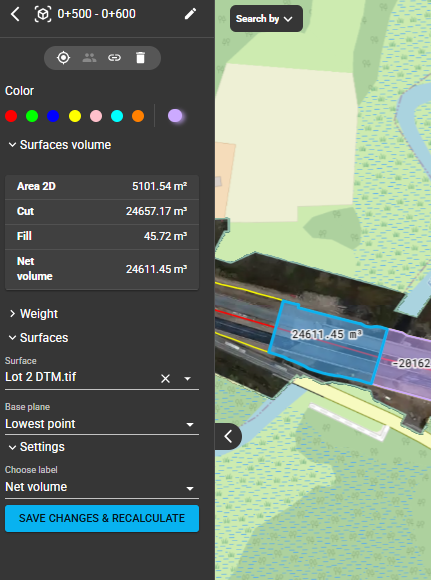
Example: after recalculating section 0+500 - 0+600 against Lot 2 DTM.tif with the Lowest point plane, the portal returns Cut 24657.17 m³, Fill 45.72 m³, Net volume 24611.45 m³.
A color palette is also available in the section panel to change the section color on the map.
Reports
You can generate the volumes as a ready-made graphic report. From the top menu, select Reports → Volume report.
In the “Volume report” window, complete the following parameters:
- Logo — your own logo file ,
- Main color — the main color of the report ,
- Area unit — the surface area unit (e.g. m2),
- Comment — an additional comment.
Click GENERATE REPORT. The completed report will be sent to your email address.
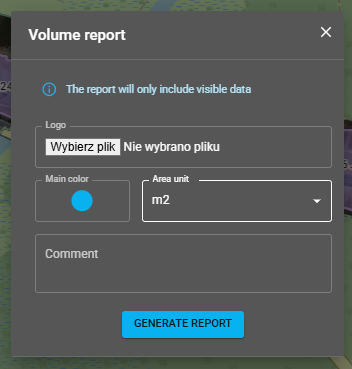
NOTE: The report includes visible data only (“The report will only include visible data”). If the project contains several sets of sections, the report will include all sections that are currently enabled. Before generating the report, make sure that only the sections you want to include are visible.
The PDF report consists of the following parts:
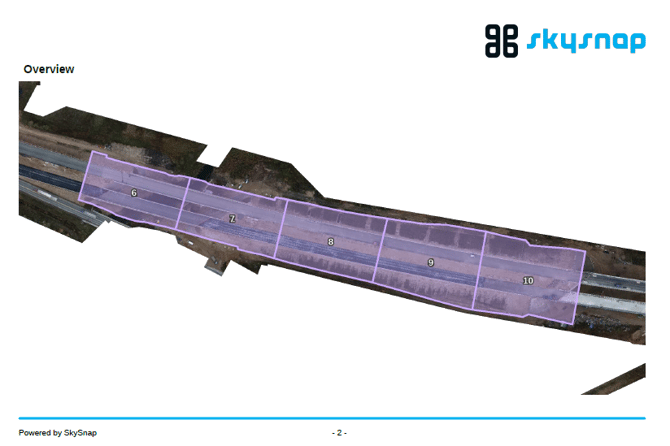
- Overview page — an orthophoto map of the entire section with the volume sections marked and numbered sequentially (e.g. 6, 7, 8, 9, 10),
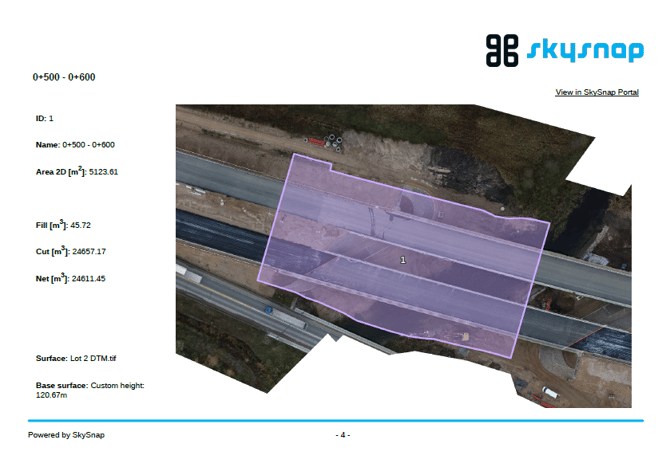
- Volumes summary table — a list of all sections, where each entry includes: ID, Name (mileage, e.g. 0+500 - 0+600, as a link), Area 2D [m²], Cut [m³], Fill [m³] and Net [m³],
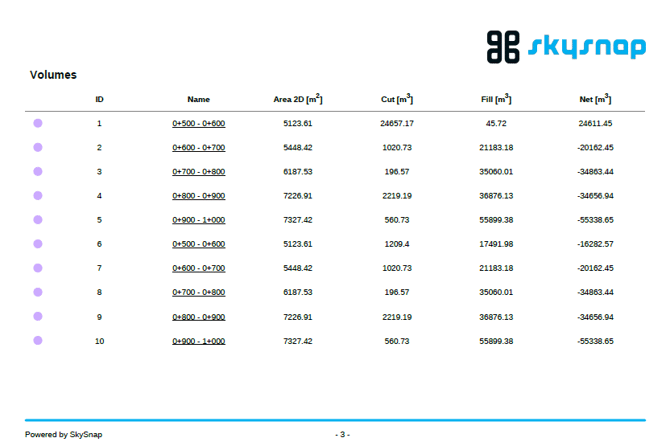
- A separate page for each section — containing an orthophoto map of the selected section and a data set including: ID, Name, Area 2D [m²], Fill [m³], Cut [m³], Net [m³], Surface (e.g. Lot 2 DTM.tif) and Base surface (e.g. Custom height: 120.67m). Each page also includes a View in SkySnap Portal link leading to the relevant section in the portal.