Table of Contents:
Proces parameter configuration
Prerequisites
To use this tool, the project must include:
- A vector line layer representing the alignment (e.g., road centerline or railway tracks).
- Elevation data (DSM/orthomosaic).
ATTENTION: The alignment must be uploaded as a dedicated data type called "stationing" and must include a "start" attribute that defines the starting stationing/mileage of the section. The portal uses this attribute to assign the correct stationing to each cross-section. Without the "start" attribute, the data will not process correctly.
Automation
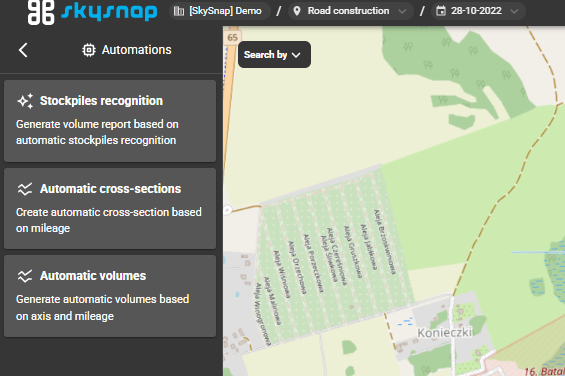
Click the "Automations" tab in the left panel. Three processes are available:
- Stockpile Detection – generate a volume report based on automated stockpile detection.
- Automated Cross-Sections – generate automated cross-sections based on the alignment and stationing.
- Automated Volumes – generate automated volumes based on the alignment and stationing.
TIP: Stockpile Detection is described in a separate article: "Automated Stockpile Detection".
Process Parameter Configuration
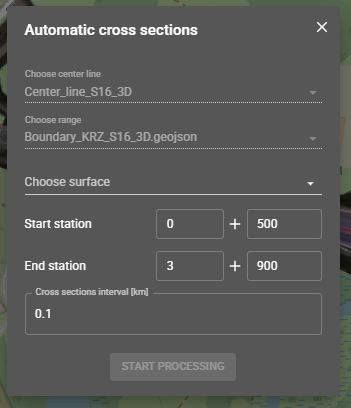
In the "Automated Cross-Sections" window, configure the following parameters:
- Alignment – the line layer along which the cross-sections will be generated (e.g., Track alignments, Road alignments).
- Select range – you can specify a vector layer to define the cutting area (e.g., Plots or Project boundaries).
- Select surface – the data layer (elevation raster) from which ground elevations will be extracted. You can select multiple surfaces at once (e.g., terrain models from different dates) — the cross-sections will be generated across all selected surfaces, allowing you to compare them on a single profile chart.
- Start / End – the stationing of the section in mileage format (split into two fields: km + m).
- Cross-section interval [km] – the frequency of the profiles, e.g., 0.02 = a cross-section every 20 meters.
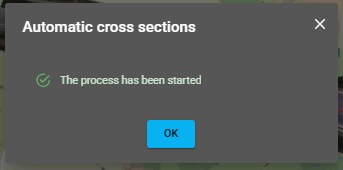
Click "START PROCESSING".
Results in the Analytics Tab
The completed cross-sections will appear in the "Analytics" tab.
Once processing is complete, the cross-sections automatically appear on the map, distributed along the alignment and labeled with their stationing (e.g., 0+500, 0+600, 0+700).
Click on any cross-section line to open its profile. The profile chart displays at the bottom of the screen and is generated based on the elevation raster (the terrain model generated from the point cloud) underlying that specific cross-section.
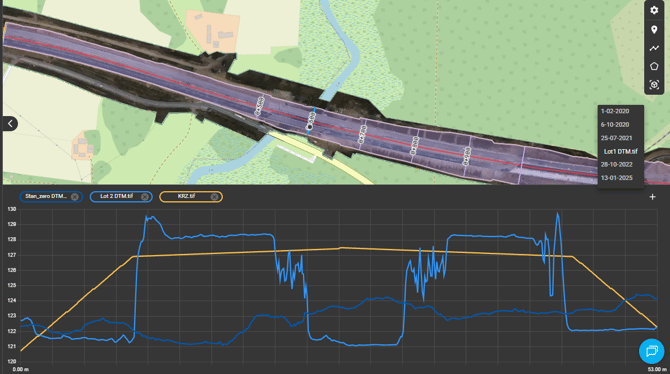
ATTENTION: The profile automatically displays only those rasters whose spatial extent overlaps with the extent of the selected cross-section line. If there are several elevation rasters in the project, but one lies entirely outside the cross-section line, it will not appear on the chart, even if the layer is turned on in the layers panel.
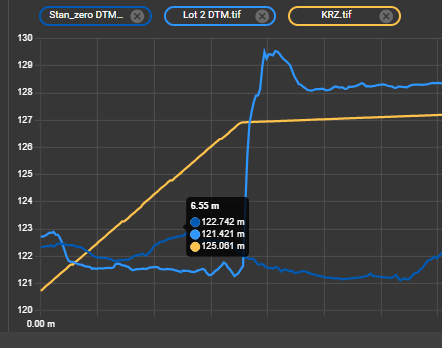
You can add additional rasters to a single profile to compare them on a shared chart. Use the plus (+) icon in the profile panel and select any other raster from the current project, from another project, or from the investment data.
Hover your cursor over any point on the profile to read the elevation. A tooltip will appear showing the distance along the cross-section and the elevation (Height H) for each raster added to the chart, making it easy to compare ground levels between surfaces.
Reports
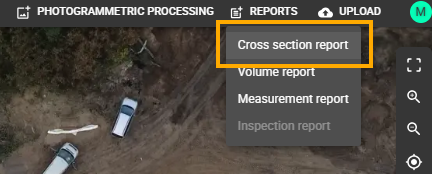
You can also generate the cross-sections as a ready-to-print graphical report. Select Reports → Cross section report from the top menu.
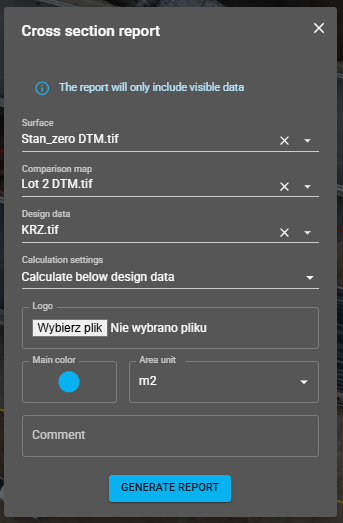
In the report window, fill in the parameters:
- Surface is the base surface (terrain model).
- Comparison map is the comparison surface.
- Design data represents the design/engineering data.
- Calculation settings defines the calculation method (e.g., Calculate below design data).
- Logo allows you to attach your own logo file.
- Main color defines the primary color theme of the report.
- Area unit is the unit of area measurement (e.g., m²).
- Comment is for any additional notes.
Click GENERATE REPORT. The completed report will be delivered to your email.
ATTENTION: The report only includes data that is currently visible. Before generating, make sure that the appropriate layers and cross-sections are turned on.
The PDF report consists of the following sections:
- Title page with basic information: Location, Coordinate system, Created at (generation date), and Reported by (author of the report).
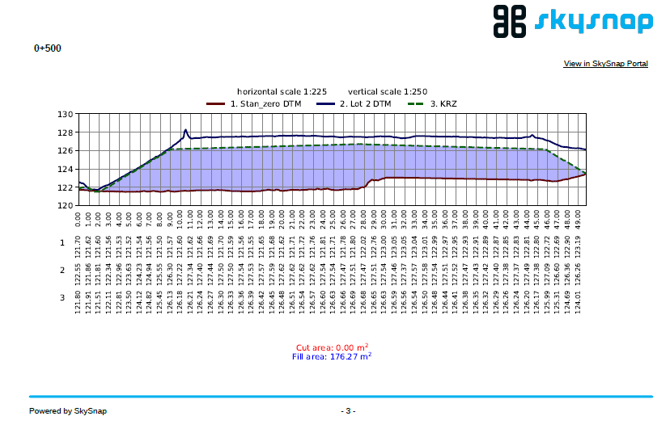
- Summary table listing all cross-sections, where each stationing point (the Name column, e.g., 0+500, 0+600) displays the cross-sectional areas: Cut [m²] and Fill [m²].
- A separate page for each cross-section featuring a profile chart that overlays all selected surfaces (e.g., baseline state, current model, design data). It includes horizontal and vertical scales, an elevation table for sequential points, and a summary of the Cut area and Fill area for that specific section. Each page also includes a "View in SkySnap Portal" link that takes you directly to that cross-section within the portal.